ShorebirdViz: Track Shorebird Migration on Your Land

What is ShorebirdViz?
Shorebirds make some of the longest migratory trips in the bird world, with some species travelling from South America to Alaska every year and seeking wetland refuge throughout their journey. To better understand shorebird movement and relative abundance, the Cornell Lab teamed up with other non-profit organizations, international shorebird collaboratives, agencies, and biologists to create ShorebirdViz. This interactive tool combines shorebird data from eBird with statistical models to produce relative population size and relative abundance estimates for 51 shorebird species across the Western Hemisphere.
ShorebirdViz and Land Trusts
Land trusts can explore which shorebirds may show up and whether they are using the area for breeding, nonbreeding, or the migration season, which helps inform critical water and wetland management priorities such as when to maintain flooded areas within the agricultural landscape as temporary wetlands. This tool can also be used to guide land easements by identifying critical wetland areas for protection or restoration where shorebirds are congregating in large numbers, especially in times of water stress. Knowing this can further help land trusts raise money to protect these species.
ShorebirdViz can be scaled to view local and continental maps to showcase the overall patterns of shorebird migration throughout the year, so landowners can see how their land fits into the bigger picture of shorebird migratory routes. Because ShorebirdViz shows different densities of shorebirds on a weekly basis throughout the year, this tool can also inform shorebird trips and workshops to engage the birding community on your land.
Using ShorebirdViz
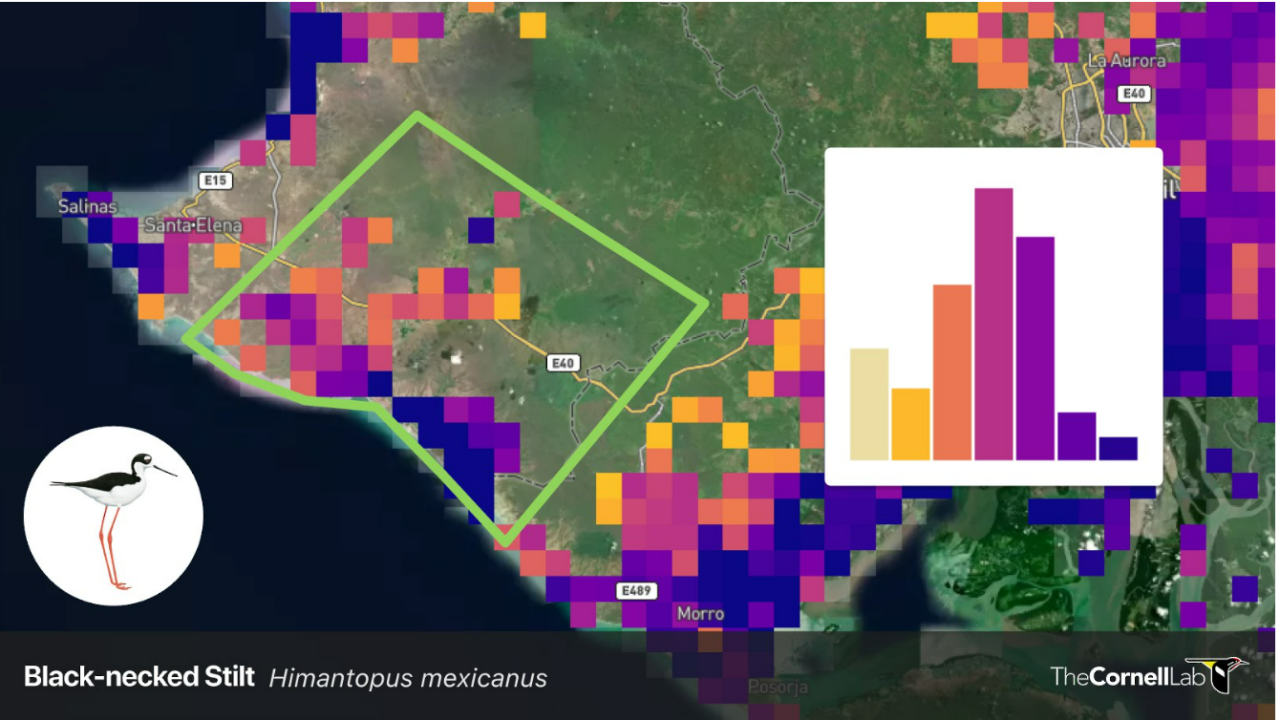
To use this tool, select a shorebird species from the dropdown menu and click a week out of the year. The map will populate with the relative abundance of your chosen species across the Western Hemisphere for that time of year. You can even draw a custom polygon on the map to generate data specific to your land trust. For example, you could draw a polygon around a land parcel of interest and have it generate data on a shorebird species’ relative abundance for that piece of land.
Curious about which shorebirds pass through your land and how to manage for them? Explore ShorebirdViz today!


