Interpretive Sign Gallery

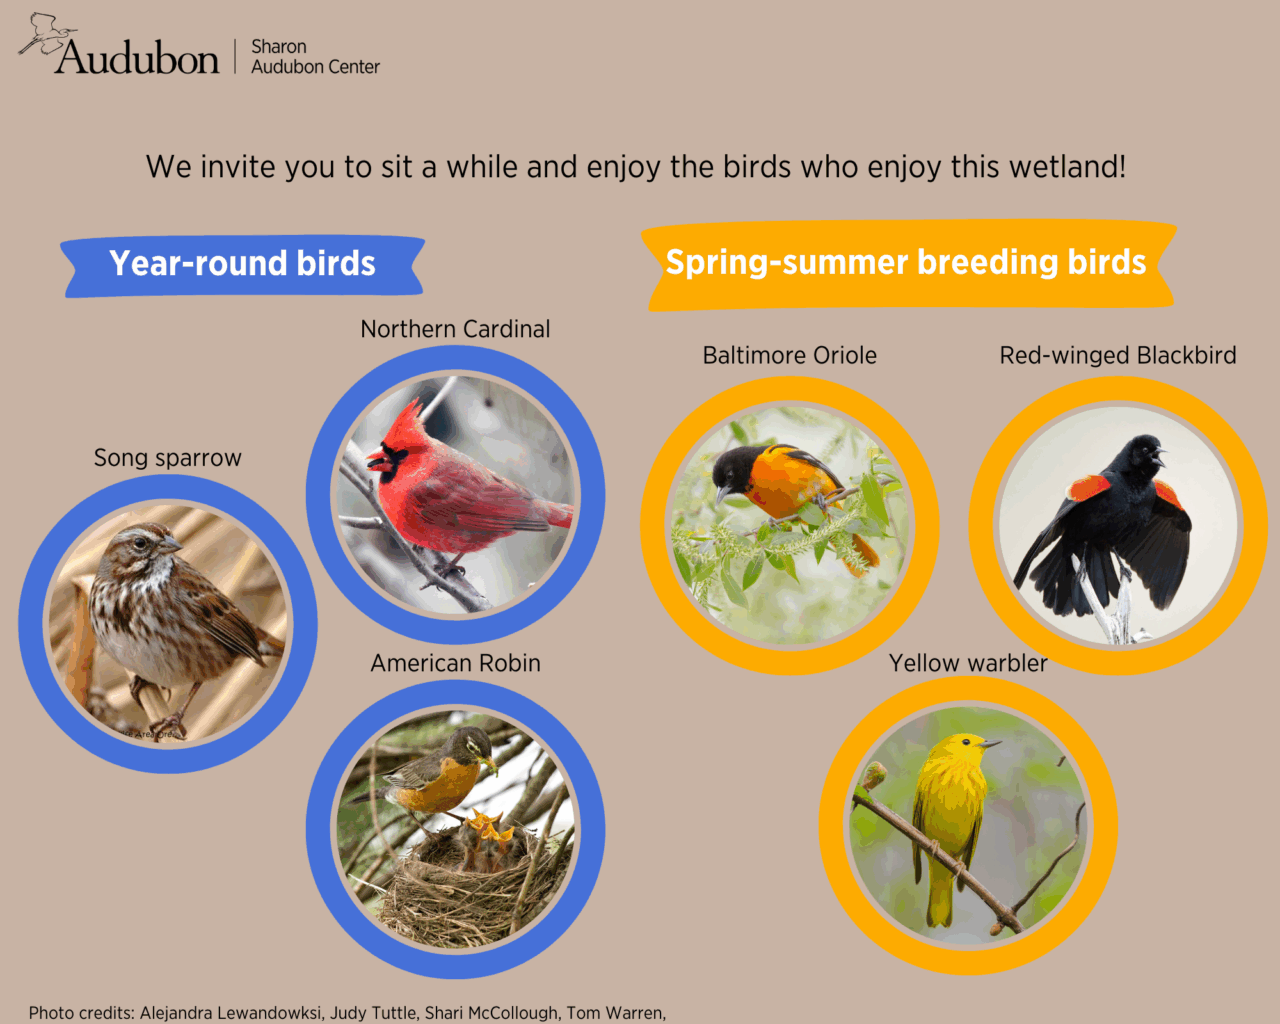
Interpretive signs can help engage community members and encourage visitors to share their bird observations. Eye-catching images along with information about species and bird-friendly habitat management can spark visitor interest and engagement—and media from the Macaulay Library may be requested for educational uses.
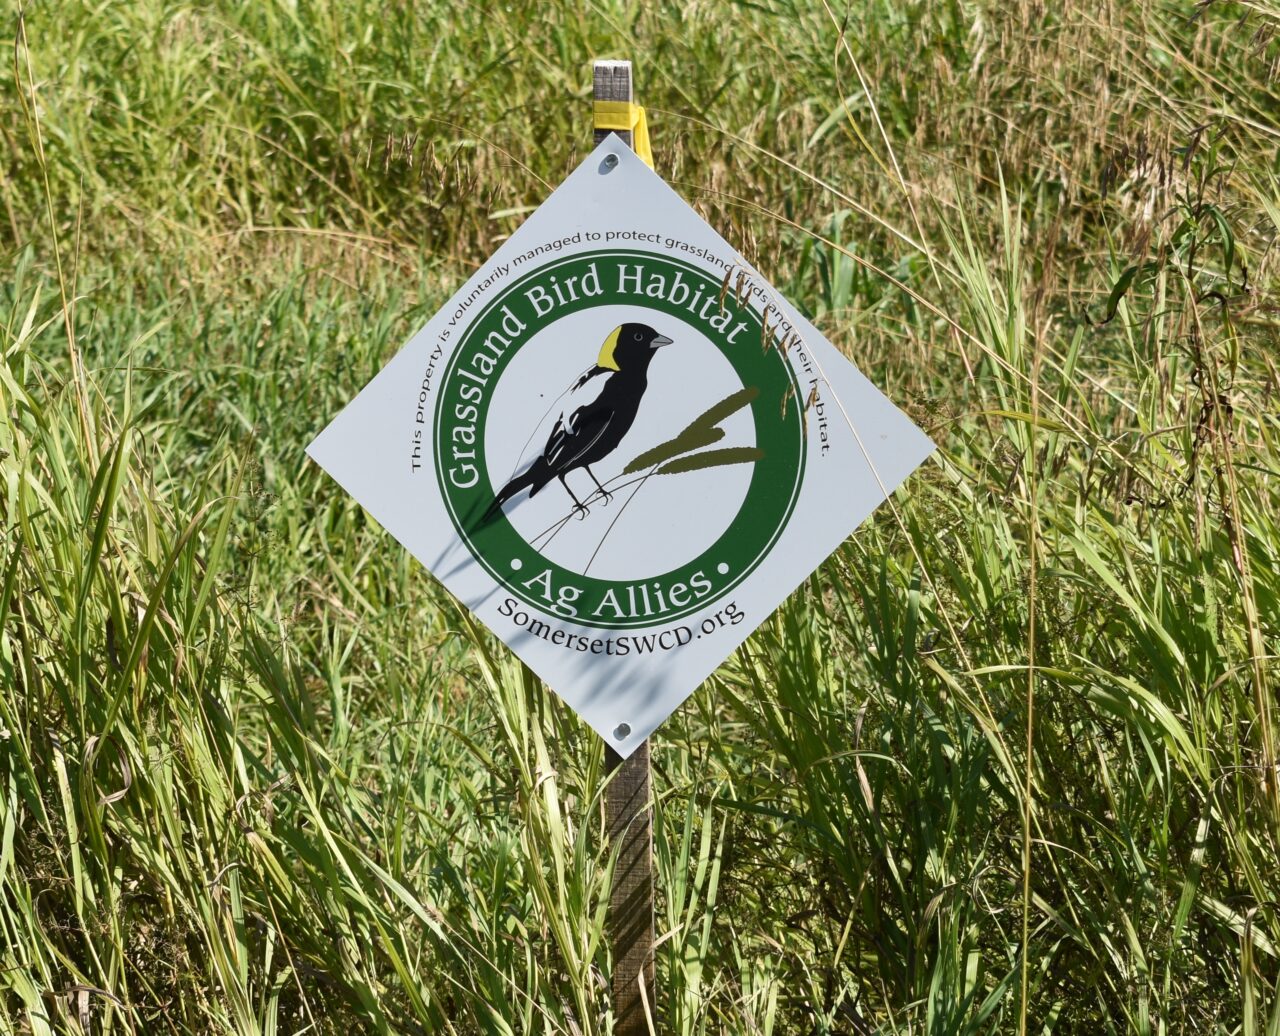
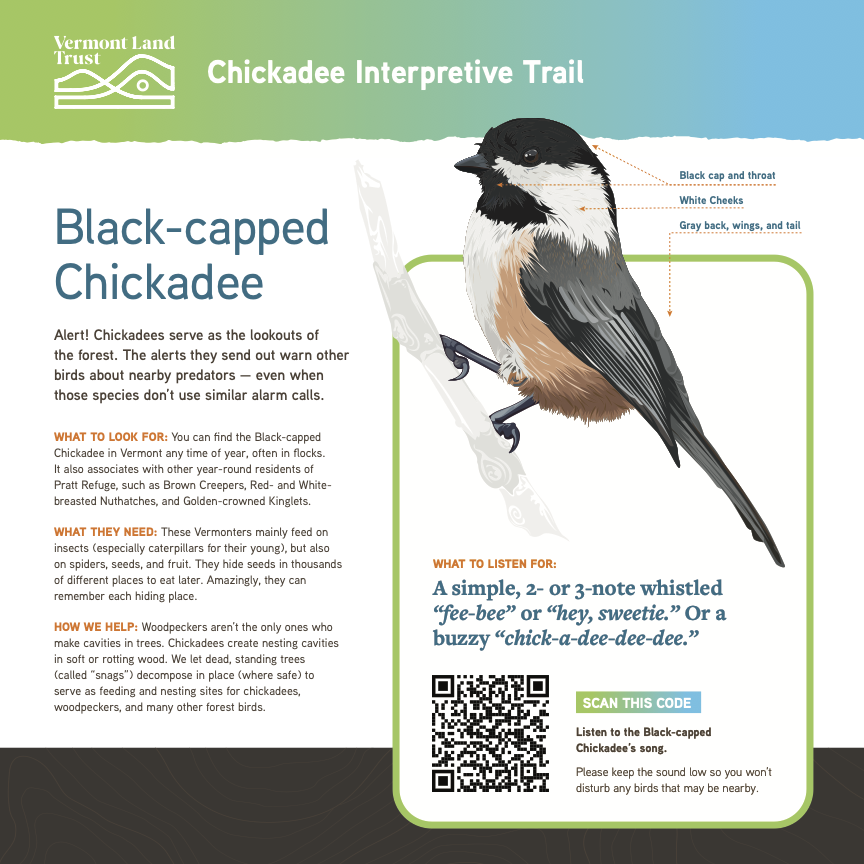
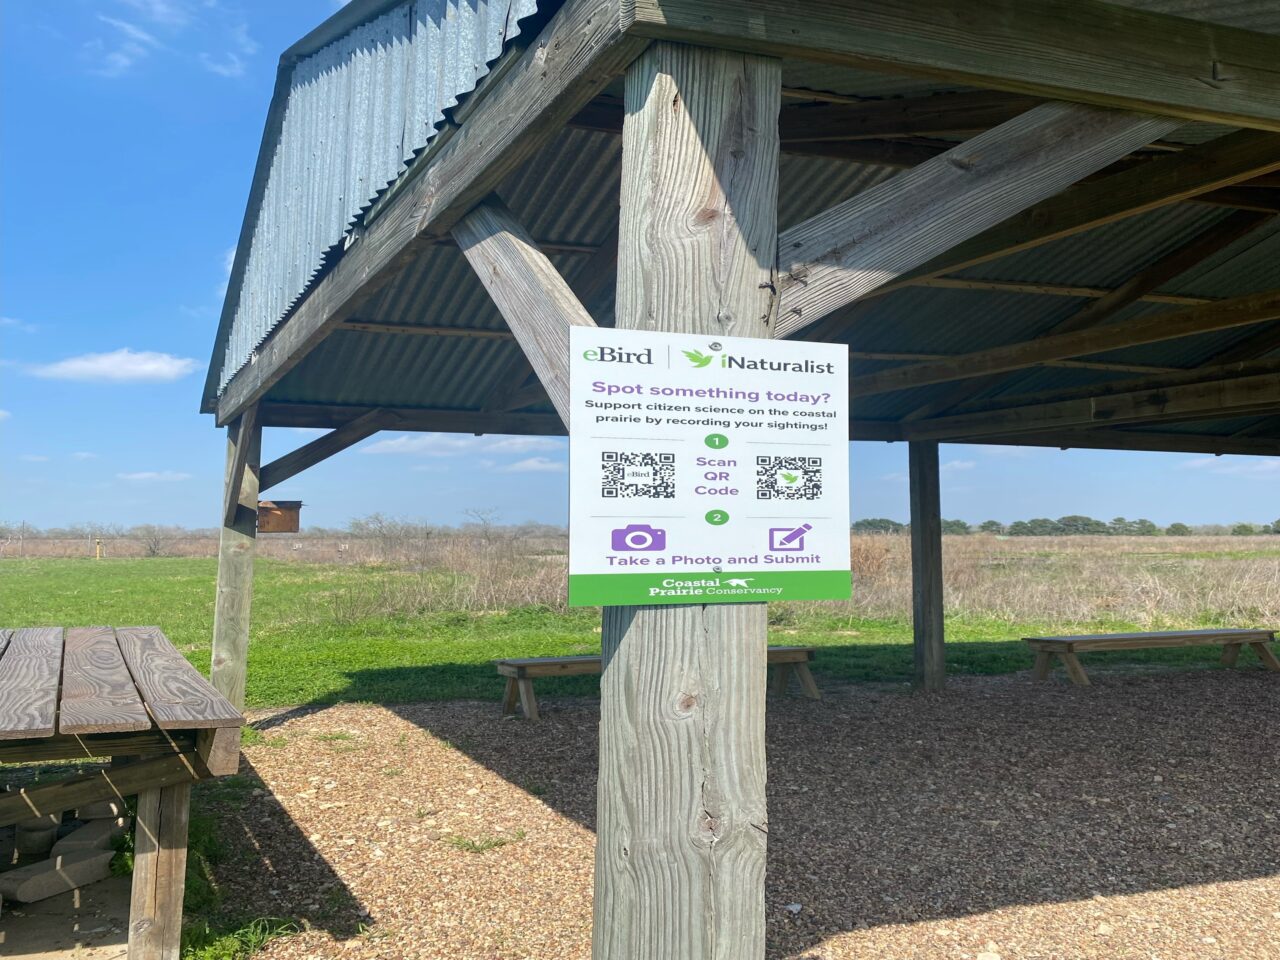
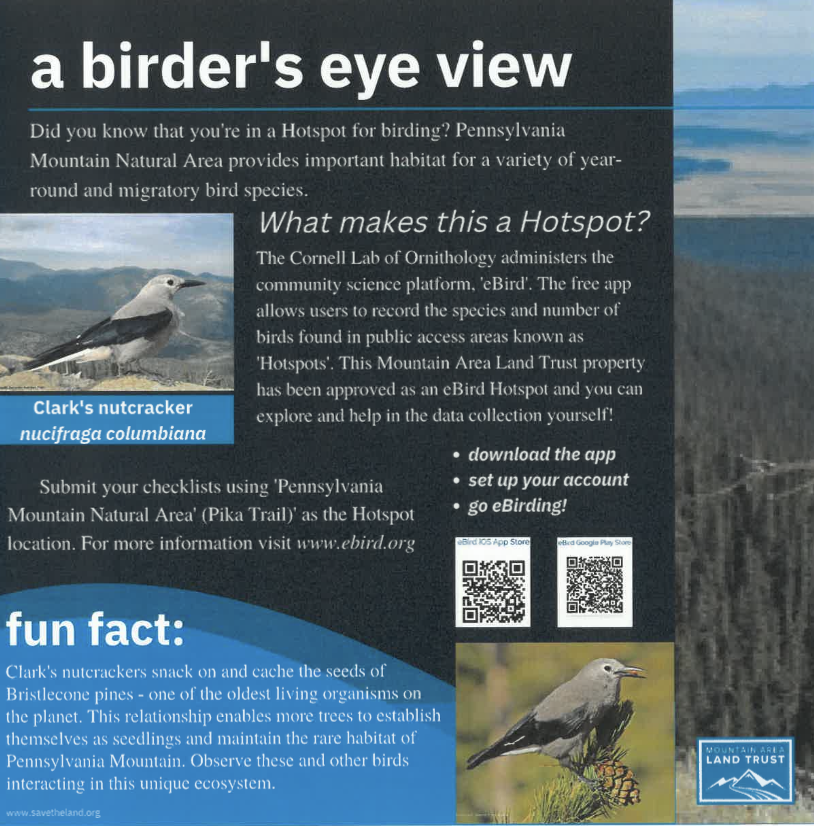
QR codes linking to eBird or to a specific hotspot can help visitors discover and contribute to your participatory science project, and QR codes linking to other resources may help visitors learn more about focal bird species.
Interpretive signs developed by land trusts and conservation organizations across the country are shared below. Use these examples as a starting point, customizing them to fit your specific context. Click the arrows beside the images to move through the examples, which are organized by theme. Scroll to the bottom of the page for resources and guidance on designing your own interpretive signs.
Restoring and Managing Habitat

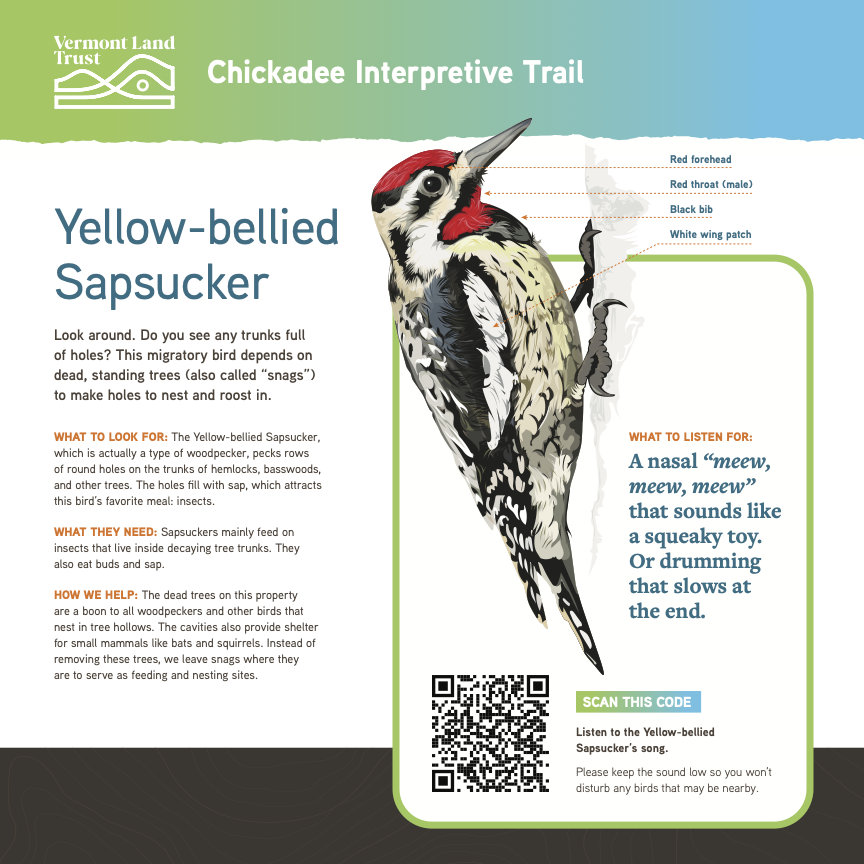
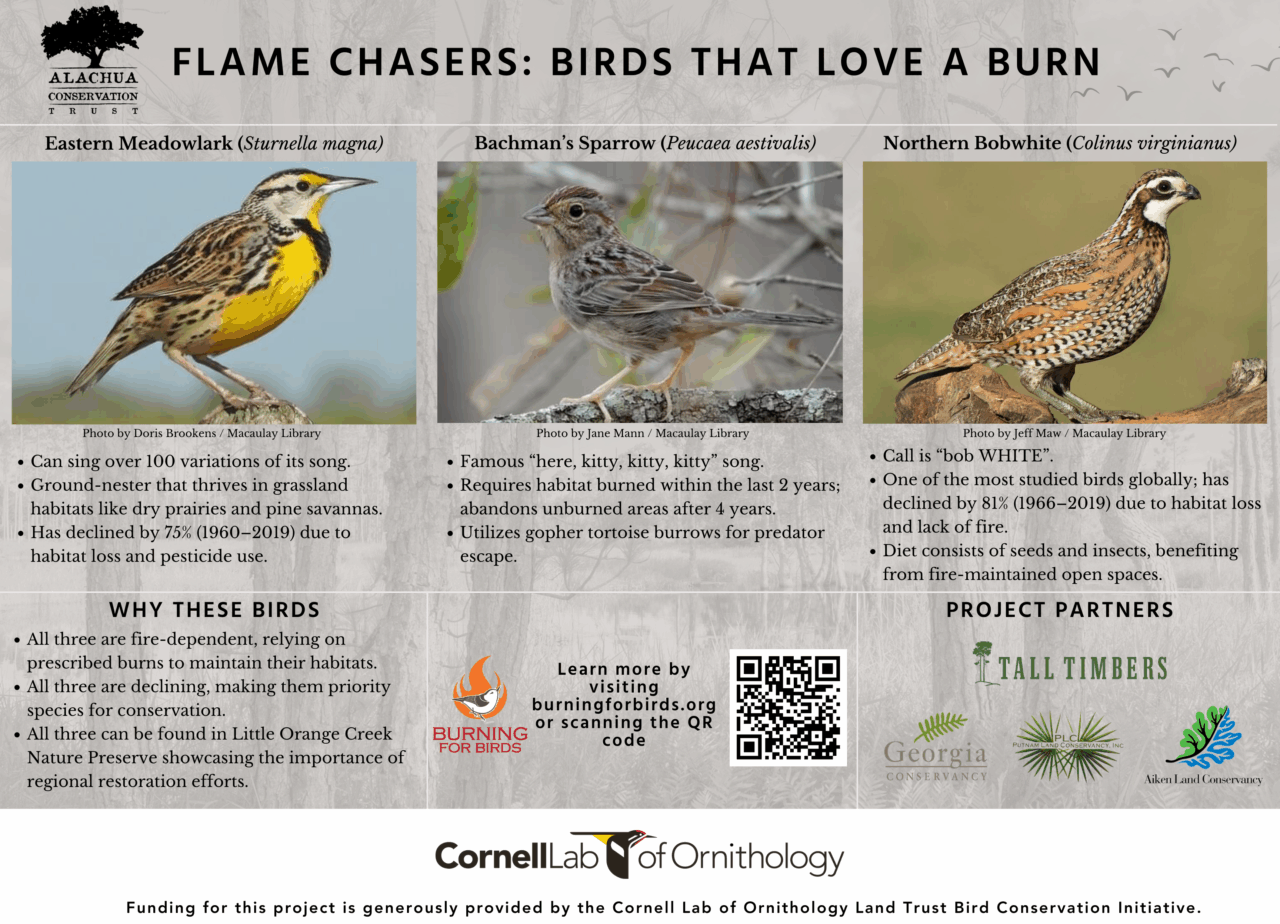
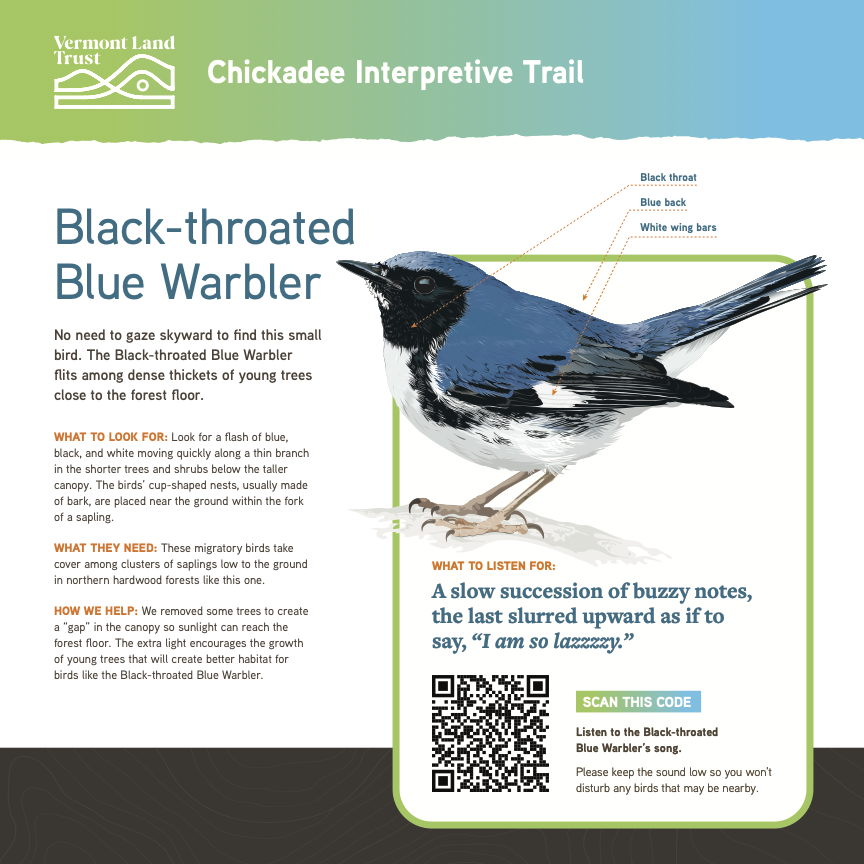
Conserving Species
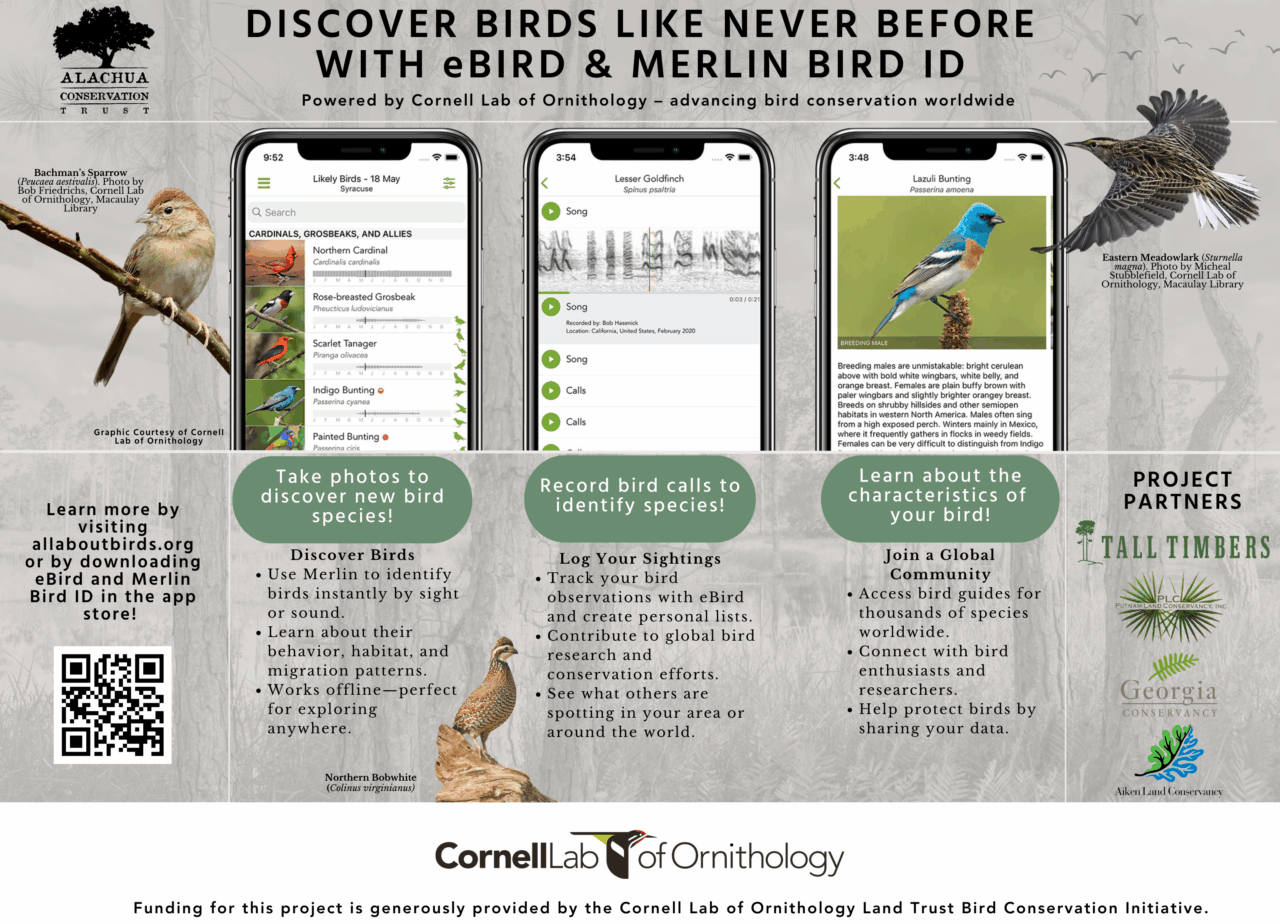
Using eBird, Merlin, and Hotspots
Principles of Interpretation
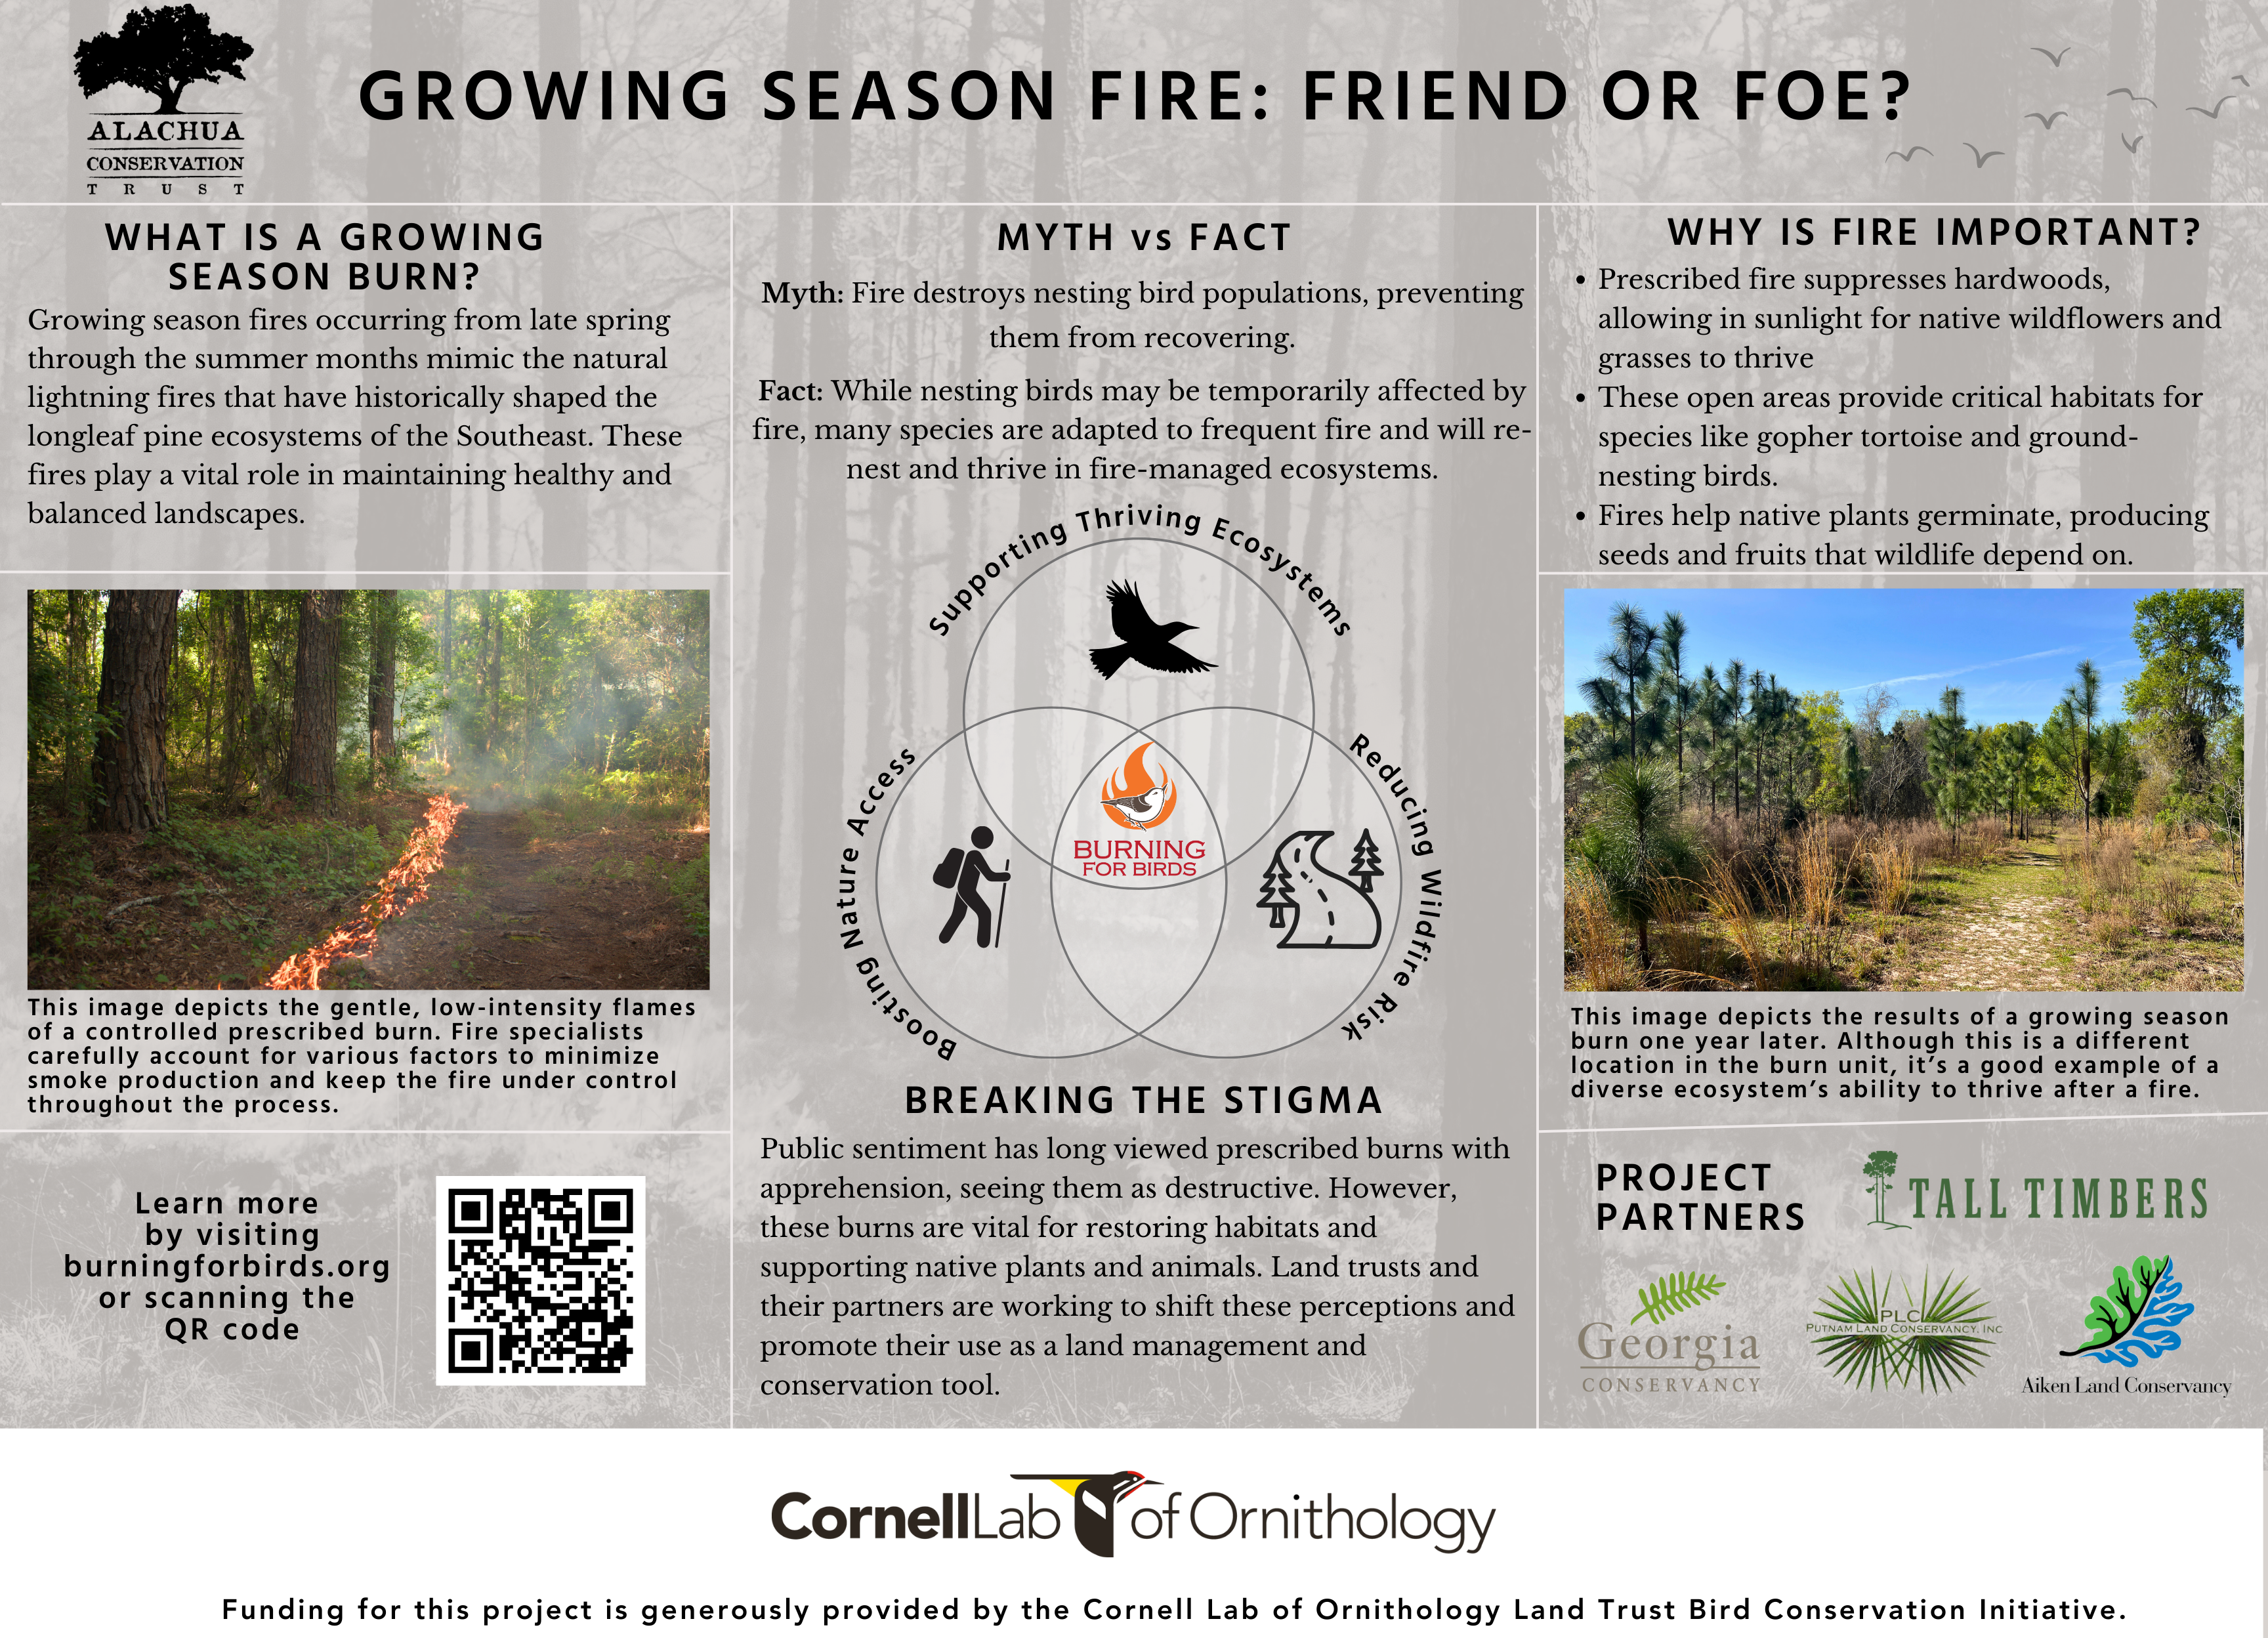
(courtesy of Aiken Land Conservancy)
- Interpretation is an art that relies on the art of storytelling
- The main aim of interpretation is provocation, not just instruction
- Good interpretation is built around a theme
- Don’t try to tell stories that aren’t yours to tell
- Make your interpretation relatable to your visitors’ lives
- Instill a sense of wonder and appreciation, and inspire a desire to conserve the resources they are learning about
- Engage with people intellectually, emotionally, and spiritually with the stories, ideas, and values of a place
Resources for Interpretive Sign Design
- Overview of Interpretive Sign Design by the Lewis & Clark Trail Alliance
- Guide to Developing Outdoor Interpretive Exhibits by National Park Service
- Advice for Planning Signs and Exhibits by American Trails
- Interpretive Signage—Getting it Right the First Time by Wayfound
- A Guide to Materials for Signs by USDA Forest Service
- So You Want to Make Interpretive Signs by Second Nature (video)
Sign up to receive our eNews and stay connected
The Land Trust Bird Conservation Initiative will send you updates about funding opportunities and ways to work with partners to protect birds and further your land conservation goals. We’ll highlight resources to assist with bird conservation on private lands, showcase tools and data visualizations to assist with planning and stewardship, and share success stories from the field.