User Guide: Priority Breeding Bird Mapping Tool
This guide helps users navigate four regional interactive mapping tools that display eBird Status and Trends data with strategic land conservation data layers to help prioritize land conservation, inform habitat management plans, and guide landowner outreach and engagement efforts, all through the lens of bird conservation. Use this guide to help you understand the data and how to utilize it best for your conservation objectives.
Mapping Tool Background
The Northeast Mapping Tool was created by partners in the Northeast Bird Habitat Conservation Initiative, a collaborative effort between The Regional Conservation Partnership (RCP) Network, Audubon groups, Highstead, and the Cornell Lab of Ornithology.
Tools in the other regions are adaptions of the Northeast Tool, and were created by the Cornell Lab of Ornithology’s Land Trust Bird Conservation Initiative and Brian Hall, a GIS consultant.
Our tools show eBird Status and Trends (eBird S&T) GIS data layers with strategic land conservation data layers to inform land planning and bird habitat conservation efforts. The eBird S&T dataset is based on bird sightings by individual birders contributing to the Cornell Lab of Ornithology’s eBird project. The modeled abundance data used here is ideal for conservation management because it accounts for data discrepancies inherent to participatory science observation data (e.g., spatial bias, detectability, search effort) using statistical and machine learning models (Fink et al. 2019).
We categorized eBird S&T data for target bird species into habitat types appropriate to each region. Within each habitat type, we selected target species based on their high priority status or climate vulnerability as shown in State Wildlife Action Plans, Road to Recovery Urgency List/Partners in Flight’s Avian Conservation Assessment Database, North American Bird Conservation Initiative, State of the Birds Report, and Audubon’s Survival By Degrees Report. Another factor considered was whether a species is included in the framework for funding programs such as Natural Resources Conservation Service (NRCS), Working Lands for Wildlife (WLFW), and the National Fish and Wildlife Foundation (NFWF).

We took the eBird S&T abundance data for our target bird species in each habitat and displayed their modeled abundance during their respective breeding seasons within 3km x 3km cells across each region. We organized the data into three categories (described in detail below): individual bird abundance and highest quality habitat data by species (Individual Bird Species Data), highest quality habitat per species by pixel (Bird Species list by Pixel), and number of bird species with highest-quality habitat data per habitat type (Habitat Quality).
This eBird S&T data can be viewed and overlaid with additional data layers to address various conservation needs. Currently, the mapping tool includes these additional layers: The Nature Conservancy’s Resilient And Connected Networks, The Nature Conservancy’s Secured Areas by GAP Status and Type, Audubon’s Important Bird Areas, and National Land Cover Database Classes.
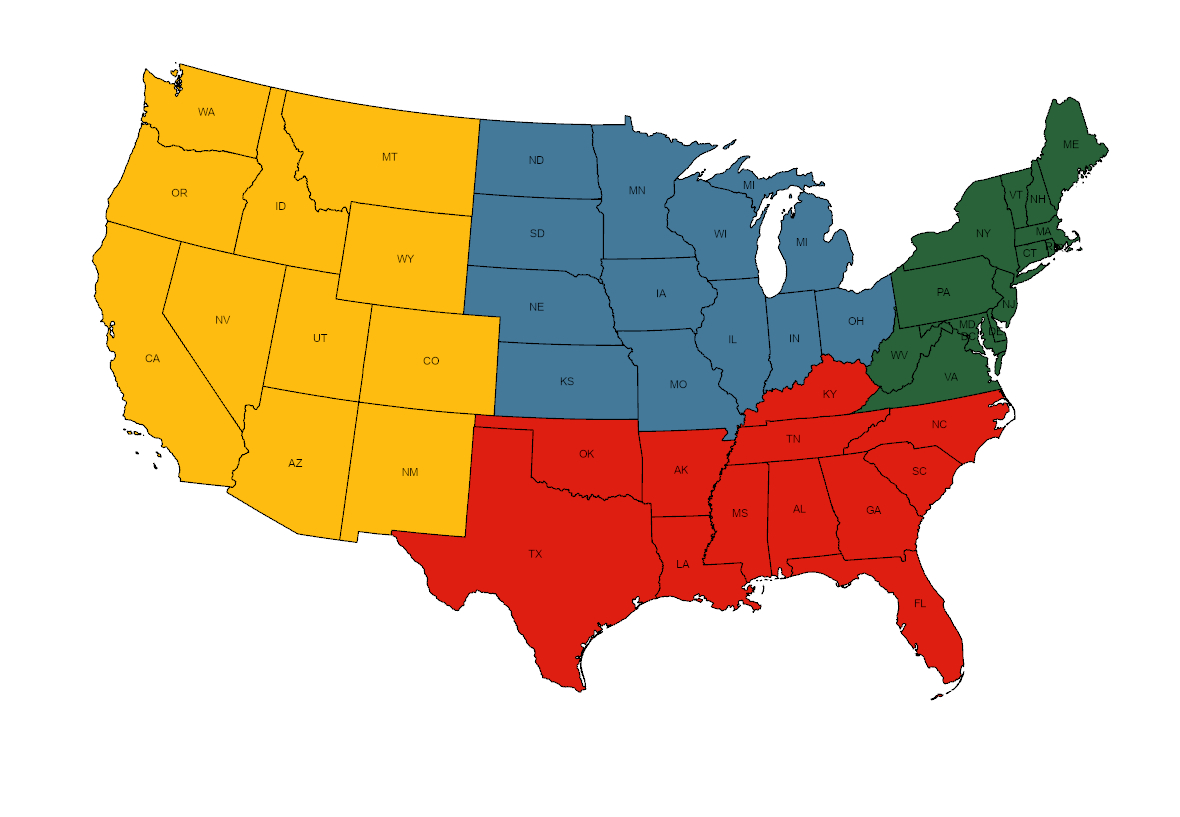
Mapping Tool Regions
| Illinois | Missouri |
| Indiana | Nebraska |
| Iowa | North Dakota |
| Kansas | Ohio |
| Michigan | South Dakota |
| Minnesota | Wisconsin |
Forest
Young Forest and Scrub/Shrub
Shoreline
Grassland
| Connecticut | New York |
| Delaware | Pennsylvania |
| Maine | Rhode Island |
| Maryland | Vermont |
| Massachusetts | Virginia |
| New Hampshire | West Virginia |
| New Jersey |
Forest
Young Forest and Scrub/Shrub
Coast and Shoreline
Grassland
| Arizona | New Mexico |
| California | Oregon |
| Colorado | Texas (western) |
| Idaho | Utah |
| Montana | Washington |
| Nevada | Wyoming |
| Alabama | Missouri |
| Arkansas | North Carolina |
| Florida | Oklahoma |
| Georgia | South Carolina |
| Kentucky | Tennessee |
| Louisiana | Texas (eastern) |
Data Layer Definitions
Individual Bird Species Data
The Individual Bird Species Data layer folder in the mapping tool contains subfolders with layers displayed for each of the habitat types in the region. Each habitat sub-folder contains abundance-derived data for the priority bird species within that habitat during each species’ breeding season based on eBird S&T data. The data is shown in 3 km2 pixels or cells across the region.
Each habitat sub-folder contains two layers per species, 1) Abundance Percentile and 2) Highest Quality Habitat.
<Species Name> Abundance Percentile
Definition
Percentile of the modeled species abundance within that habitat type. A percentile is a value on a scale of 1-100 that indicates the percentage of cells that are less than or equal to it. For example, a score in the 95th percentile means that it is equal to or better than 95% of the scores.
This concept is easier to understand with an example: the 20th percentile is the value (or score) below which 20% of the observations (cells) may be found; conversely, in the 20th percentile, 80% of the cells have higher modeled abundances. <Species name> Abundance Percentile is depicted along a color gradient from a light color indicating lower abundance to a dark color indicating a higher abundance. Please view the legend for species of interest to see the range in abundance values. Note: In this project, we express each cell as the percent of cells that have modeled abundance values greater than 0; thus, a cell percentile is relative to the other cells that had the bird as opposed to all cells in the whole region.
Potential Use Ideas
Land trusts and practitioners can use these data to determine where to join parcels on the landscape to create connectivity for birds or specific species of conservation concern. It can be used (note: could also be helpful to turn on the TNC Secured Areas layer) to help inform strategic conservation plans when trying to connect urban and suburban areas by identifying small and medium woodlots (and other green spaces) to increase value as a whole for birds and biodiversity. These data and the following layers can also be used to provide metrics for grant applications to justify suggested conservation efforts, demonstrate the need for habitat management and restoration, and engage donors and grantors in the power of birds as indicators of healthy ecosystems.
Map Example

At a Northeast regional scale, Brown Thrasher Abundance Percentile under the ‘Scrub/Shrub and Young Forest’ subfolder, shows, for example, that Maryland has a high abundance of Brown Thrashers, whereas Vermont has a lower abundance of Brown Thrashers. This is indicated by the fact that the mapping tool shows a high density of dark red cells in Maryland, whereas Vermont shows fewer dark red cells.
<Species Name> Highest Quality Habitat
Definition
These areas were defined as those cells within the top 30% (i.e. in the 70th percentile or higher) of the values in that species’ Abundance Percentiles (see above) signifying areas that could be of the highest quality habitat for the selected species. This “thresholding” was done to provide users with a simplified version of the modeled abundance data by reducing the 100 possible blue-to-red abundance percentiles and converting them to Top 30% or Not Top 30% for each species.
Specifying the top 30% cutoff was largely a subjective decision and was picked by our team in consultation with many bird experts as a good compromise between identifying too many or too few areas for each species. If the cutoff was too low, we also feared that many of the areas shown would not be good habitats and could be detrimental to the species.
Potential Use Ideas
This information can be used in a presentation to show landowners how important their land is within the region and illustrate with maps how their land brings value to conservation projects and goals within the larger landscape. Conservationists and land trusts can also use this layer, in combination with the Habitat Quality and TNC Secured Areas layers, to identify areas for habitat improvement and conservation for their priority or focal bird species.
Map Example

At a Midwest and Central regional scale, under the scrub/shrub and young forest layer, Bell’s Vireo Highest Quality Habitat shows only those cells (represented by purple pixels) where the abundance is in the top 30% for this species within the region. Purple pixels represent high-quality habitat areas, and lower-quality habitats are gray pixels. Kansas has the largest number of these highest quality habitat pixels in this region.
Bird Species List by Pixel
Definition
This layer allows you to view a full species list (from the list of priority birds in the region) that occur within a particular area (3 km x 3km pixel) on the map. When a user turns this layer on and clicks on a cell or group of cells on the map, a table will pop up showing which species (by habitat type) have their highest quality habitat (top 30%) within that highlighted area as signified with a number one next to the name and those that do not, as signified by a zero. Note: the original eBird S&T cells are merged with adjacent cells if they have the same species in common.
Potential Use Ideas
Land trusts and practitioners can use these lists to generate interest and engage landowners in conservation and management by sharing with them a list of birds that are predicted to be on their property from statistical and machine learning models given eBird observations matched with characteristics of the local environment. If a landowner would like to put an easement on their property, this information can help a land trust determine what species they could look for in the field and help inform the stewardship plan for the property. These bird data can also help a landowner gain a better understanding of the habitats that might be most important to protect and manage on their property and then they can contact local or regional organizations to learn more about how best to manage their property for birds (such as connecting with the Forestry for Michigan’s Birds program).
Map Example

In this example, the Bird Species List by Pixel layer is on and a cell in Wisconsin has been clicked. This results in a pop-up table with a list of all 50 priority bird species in the Midwest and Central region; a number one is next to the species that have their highest quality habitat (top 30%) within the highlighted cell, and a number zero next to those that do not.
Habitat Quality
Definition

This layer shows the number or sum of priority bird species of a given habitat that have their Highest Quality Habitat (top 30% of Abundance Percentiles) within that cell. For example, in the Forest-Bird Habitat Quality layer in the Midwest and Central Tool, a dark green cell has a value of 8, meaning that 8 out of the 12 forest species have their Highest Quality Habitat within that cell.
Potential Use Ideas
These layers give an overall look across the landscape by habitat type. Land trusts and other conservation organizations could use these layers to identify potential high-quality habitats by habitat type (forest, scrub-shrub, grassland, etc.) to identify target areas for improved management. Additionally, land trusts could use these layers in combination with the TNC Secured Areas layer to identify priority areas for management (where habitat can be improved) and conservation (where high-quality habitat exists and is adjoining or close to protected areas, but is not already protected). A user can turn on the TNC Resilient and Connected Networks and Habitat Quality layers and pick out areas that a conservation organization might wish to target for land protection or easement acquisitions when considering climate resiliency and birds of conservation concern. These areas that fall out with a large number of target species may be more dynamic habitats that are biologically diverse and thus are likely important areas to protect.
Map Example

In the Northeast region, there is a high forest bird habitat quality cluster at the border of Maine and Canada. The areas in orange to dark red show that 5 or more of the 7 priority birds for forest habitat co-occur in their highest abundances (top 30%) in this region.
TNC Resilient and Connected Networks (Simple Version)
This layer depicts a simplified version of The Nature Conservancy’s climate resilience and regional flow data layers. The layer shows a proposed conservation network of climate-resilient sites that, if conserved, may help sustain biodiversity. Climate resilient sites are areas buffered from climate change because they contain many connected microclimates that create climate options for species. For more information, visit The Nature Conservancy’s Resilient and Connected Network description page on ArcGIS.
Legend Definitions
Resilience and Recognized Biodiversity: Areas with high microclimatic diversity, low human modification, and known biodiversity value (rare species, intact habitat, or exemplary natural communities) based on ground inventories.
Resilience and Flow: Areas with high microclimatic diversity, low human modification (resilient sites), and concentrated climate flow zones. Concentrated climate flow zones are areas where climate change-driven population movements are expected to be concentrated through narrow areas. Because of their importance in maintaining flow across a larger network, these pinch points are good candidates for land conservation.
Resilience, Flow, and Recognized Biodiversity: Areas with high microclimatic diversity, low human modification, known biodiversity value (rare species, intact habitat, or exemplary natural communities), and concentrated flow zones.
TNC Secured Areas by GAP Status and Type 2024
The Nature Conservancy’s Secured Areas by GAP Status and Type layer shows public and private lands that are permanently secured against conversion to development through fee ownership, easements, or conservation focused designations (GAP 1-4). GAP status is a classification developed by the US Fish and Wildlife Service, to reflect the intent of the landowner or easement holder. For more information, visit TNC Secured Areas by GAP Status and Type page.
National Audubon Society Important Bird Areas
National Audubon Society Important Bird Areas (IBAs) represent critical habitats for the survival and conservation of birds. An IBA is a site that provides essential breeding and/or non-breeding habitat for bird species or a group of species-of-conservation-concern. To be designated an IBA, a site must meet at least one of several criteria relating to its significance for threatened bird species, congregations of birds, and/or habitats important to assemblages of birds. For more information, read Audubon’s Important Bird Areas: A Valuable Tool for Protecting the Places Most Crucial to Birds or watch a brief video explanation.
Legend Definitions
Continental: Species of continental conservation concern, assemblage, or group of bird species, in a BCR.
Global: Species of global conservation concern, assemblage of restricted-range species, assemblage of biome-restricted species.
State: Species of state conservation concern, species in rare/unique habitat.
National Land Cover Database Classes
This EPA content item displays National Land Cover Database (NLCD) land cover classes for the coterminous United States in 2019.
NLCD is a “living” database designed for land cover monitoring and is updated every 2-3 years with time-integrated changes in land cover. This layer displays land cover for the coterminous United States in 2019 as generalized into 20 classes. For more information, visit National Land Cover Database (NLCD) Classes (MRLC 2019).
RCPs (Regional Conservation Partnerships)
Available only in the Northeast region, this layer includes information about Regional Conservation Partnerships (RCPs), which are groups of people, organizations, agencies, and others working together to increase the pace and practice of landscape conservation across municipal, state and regional boundaries.
Legend Definitions
Outlines: Regional Conservation Partnership (RCP) Boundaries: The RCP Network boundaries are available as a layer on the map and encompass the area each RCP works in.
RCPs: Each polygon contains the location and contact information for an RCP member; these are embedded (click on polygons) with RCP contact information.
Request Bird Data
These derived datasets can be downloaded for use in your own GIS and will be distributed to users via an MPK file sent via email. Requestable data includes:
- Individual Bird Species Data (abundance percentile and highest-quality habitat by species)
- Bird Species List by Pixel
- Habitat Quality
To request to download Priority Breeding Bird Mapping Tool data, please fill out the data request form for your region of interest.
Tool Citations
The data and tool must be cited in any original work that uses this tool or data.
Data Citation: Fink, D., T. Auer, A. Johnston, M. Strimas-Mackey, O. Robinson, S. Ligocki, W. Hochachka, L. Jaromczyk, C. Wood, I. Davies, M. Iliff, L. Seitz. 2021. eBird Status and Trends, Data Version: 2020; Released: 2021. Cornell Lab of Ornithology, Ithaca, New York. https://doi.org/10.2173/ebirdst.2020
Northeast Tool Citation:
Northeast Bird Habitat Conservation Initiative; 2022. Northeast Bird Habitat Conservation Initiative Mapping Tool. Retrieved [month date, year] from https://bit.ly/PriorityBirdMappingToolNE
Midwest and Central Tool Citation:
Midwest and Central Priority Breeding Bird Mapping Tool; Released 2025. Land Trust Bird Conservation Initiative, Cornell Lab of Ornithology, Ithaca, New York. Retrieved [month, date, year] from https://bit.ly/PriorityBirdMappingToolMC
Contact Us
Please reach out to the co-coordinators of the Northeast Bird Habitat Conservation Initiative with any questions or feedback about the Northeast Tool:
- Katie Blake, Conservationist, Highstead, kblake@highstead.net
- Sara Barker, Land Trust Bird Conservation Initiative Project Leader, Cornell Lab of Ornithology, sb65@cornell.edu
Please reach out to the project manager with any questions or feedback about tools in the other regions:
- Sara Barker, Land Trust Bird Conservation Initiative Project Leader, Cornell Lab of Ornithology, sb65@cornell.edu