Diving Into the Science Process
As a child, you probably learned the scientific method in school, and it provided a step-by-step way to conduct a scientific experiment. It was a method that likely worked well for some of your favorite “cookbook” labs (think baking soda and vinegar volcanoes or growing sugar crystals) but, it’s not a realistic representation of how real-world scientific inquiry happens. To better align the teaching of science in the classroom with how it’s carried out by scientists every day, educators are moving toward a more realistic way of teaching science. After all, doing science out in the real world is often nonlinear, iterative, and a more complex practice than the scientific method suggests.
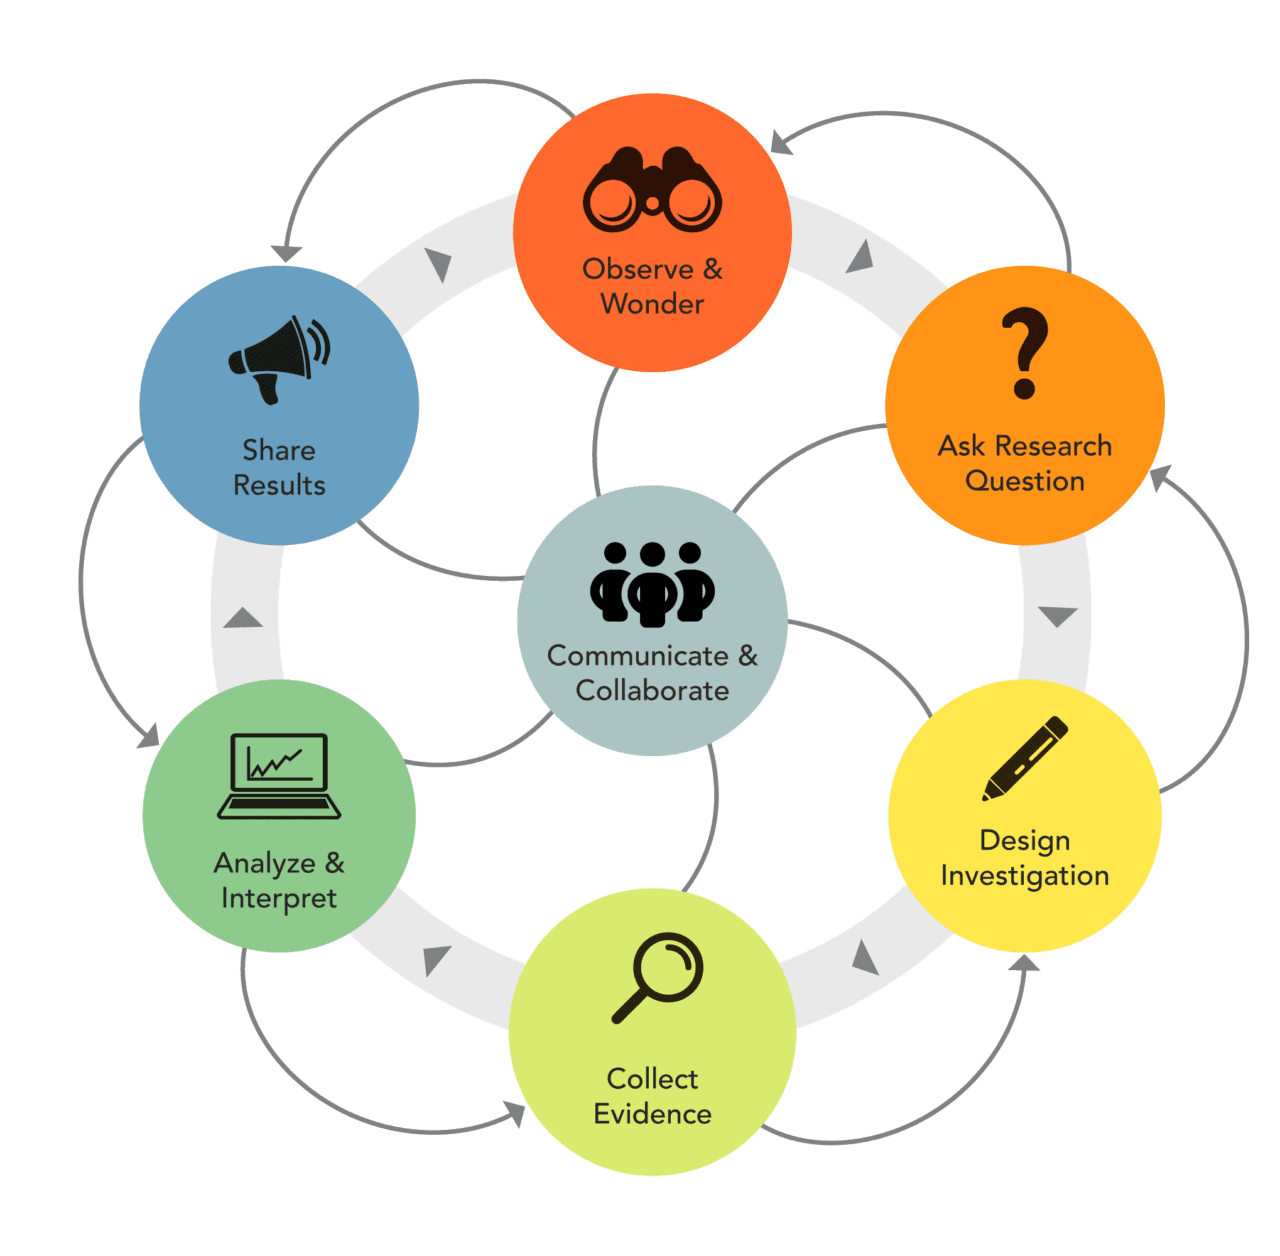
Hence, the K-12 Education Team partnered with a team of scientists at the Cornell Lab of Ornithology (Carrie Branch, Jennifer Houtz, Monique Pipkin, Anusha Shankar, Andrew Stillman, and Benjamin Van Doren) to illustrate the realities of doing science in a way that could be understood by K-12 students (Figure 1). This science process offers a flexible approach to scientific exploration, allowing scientists to enter at various points and in diverse ways. Its interconnected components encourage individuals to wonder about and observe their surroundings and seek answers to those questions. Communication, collaboration, curiosity, creativity, and adaptability are all essential aspects of this process. Unlike a step-by-step recipe, the science process invites students to embrace uncertainty, revise their ideas, and explore new avenues of investigation. Download the poster to share with your students and dive into the details below!
Elements of the Science Process
Communicate and Collaborate
Communication and collaboration are central to all parts of the science process. Effective communication and collaboration enhance the exchange and refinement of ideas, bring about new perspectives, and promote collective problem-solving in scientific research.
Scientists can help bring about positive changes in society by sharing their findings with the public, policymakers, and other scientists. Encourage students to think about how their research can be useful to others, sparking an even greater sense of curiosity and wonder.
Observe and Wonder
Scientists are professional observers! They use their curiosity and observation skills to ask questions about the natural world. Scientists may be inspired by a variety of things, including societal needs, observation of a phenomenon, a new discovery or technology, curiosity about how something functions, or the desire to solve a problem.
Observing and wondering sparks curiosity and helps lay the foundation for scientific inquiry. You can help students investigate personally relevant topics by inspiring them to closely observe their surroundings, explore their environment, and discover the natural world with all their senses and tools available to them.
Ask Research Question
Questions are an essential part of science. Think of a research question as a compass, guiding scientists and students through uncharted territory. Just as a compass helps sailors find their way at sea, a well-crafted research question points researchers toward their objectives. Like a compass needle, a clear research question ensures that investigators stay on course and directs their focus, helping them navigate the complexities of data collection, analysis, and interpretation. To learn more about how to inspire students to ask curious questions, check out our free Spark Guides!
Design Investigation
While questions are a compass, scientists chart their course by designing an investigation – a plan for collecting evidence that will answer their testable question. In this part of the science process, students plot their course by conducting background research and setting up a plan for collecting evidence, including the tools, methods, and data they will collect. Don’t try to make this perfect for your students. An investigation that doesn’t go as planned is just as valuable in the learning process. Let students take the lead, experience challenges, and make adjustments. Real scientists do this all the time! The Students as Scientists Teacher’s Guide and supplemental resources give you the tools and resources you need to guide your students through the choppy waters of how to carry out background research from reliable sources, formulate hypotheses, and design an investigation that will provide meaningful data.
Collect Evidence
Once the investigation is planned, a scientist begins collecting data, also called evidence. Evidence can either be quantitative (aka numerical) data, which answers questions like “how much,” “how many,” or “how often” or qualitative data, which is information and concepts that are not represented by numbers. Data can be evidence collected directly by a scientist through observation, qualitative data, and/or quantitative measurements or it can be data collected by other people (such as participatory science data). It’s common for scientists to collect different types of evidence in investigations.
While collecting evidence, students may find that they need to modify their investigation design. Quite often while carrying out the investigation a new discovery, another question, or an observation is made that leads to a new research question, a modification to the design of the current investigation, or the need to develop a whole new investigation design. This is a normal part of the science process, highlighting the benefit of adaptability.
Analyze and Interpret
Your students have spotted land with their data in tow. But how do they reach their final destination? It’s time time to analyze and interpret the data to make it to shore! Data analysis may include creating and iterating tables, graphs, maps, models, and diagrams, and calculating statistics or other mathematical computations that help reveal and illustrate the patterns and relationships in the data.
Once data is analyzed, it is ready for interpretation, which creates meaning from the data generated during the investigation. Data interpretation combines the analysis conducted by the students, background knowledge generated from earlier studies, and applying scientific principles and reasoning to the new data collected. By analyzing and interpreting their findings students can explore explanations to their original research question.
Share Results
Sharing results is much like landing ashore. Your students have arrived at their destination and soon new endeavors will arise (or if you’re a scientist, new observations and wondering will have you embarking on another investigation). Think of renowned scientists like Jane Goodall, Carl Sagan, and Neil deGrasse Tyson. Not only are they brilliant researchers, but they also excel as science communicators. In today’s interconnected world, creativity knows no bounds when it comes to sharing findings. Whether through peer-reviewed journals, blogs, infographics, podcasts, or entertaining YouTube videos, scientists and students alike contribute to the ever-evolving world of scientific knowledge.
Sharing results extends beyond communicating ideas with others, it also encompasses the peer-review process where scientists (and students) check each other’s ideas to improve their own, a time where open communication and collaboration are especially important to the process.
…
The science process serves as a dynamic framework to help individuals explore, question, and discover the wonders of the natural world. By embracing the interconnected elements of the process, students embark on a transformative journey that cultivates critical thinking skills, nurtures curiosity, and fosters an appreciation for the beauty and complexity of scientific exploration. Through effective communication, collaboration, and a commitment to sharing results, scientists and students enrich their understanding and contribute to the collective knowledge of the scientific community. Using the science process, students embark on a voyage of discovery, innovation, and lifelong learning that has the potential to shape their perspectives and fuel their passion for science.
This resource was developed with the generous support of private foundation funds,
3-D® Pet Products, Wild Delight® Outdoor Pet Products, and Better Bird©