State-level eBird Data Summaries
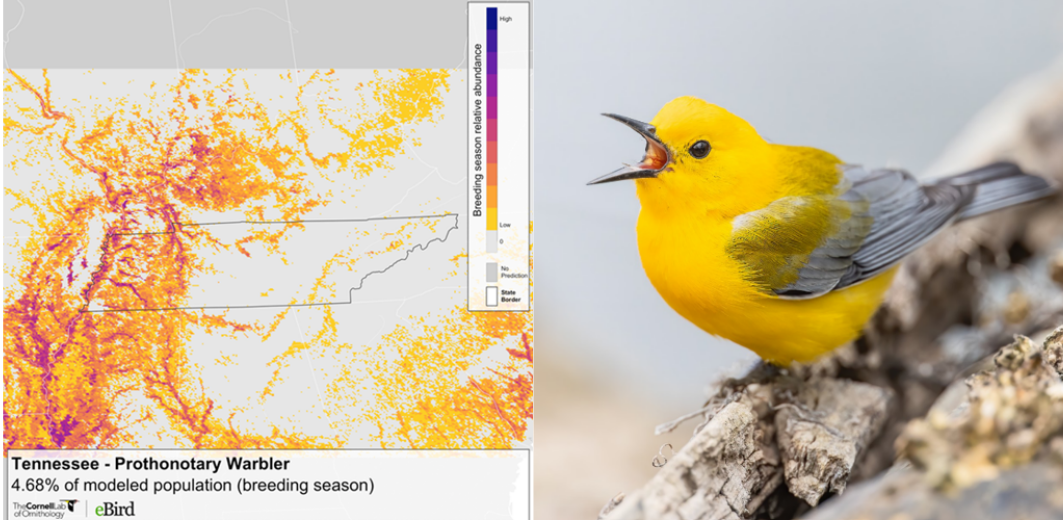
Prothonotary Warbler by Ryan Sanderson / Macaulay Library
What Are State-level eBird Data Summaries?
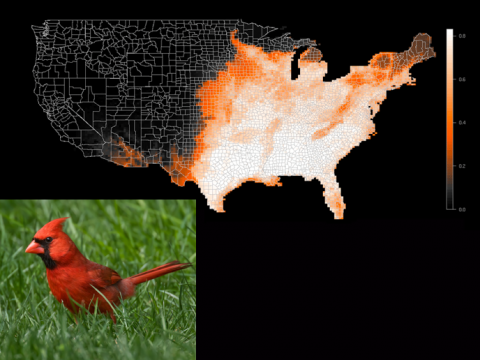
The eBird state-level data summaries are downloadable data products from eBird Status and Trends that provide summaries at a state level for relative abundance and population metrics. “Relative abundance” is defined by eBird as the count of individual birds of a given species listed on an eBird checklist travelling 1 kilometer for at least one hour. Each state has a file that can be downloaded and contains GIS-ready layers and a table of information such as species with high conservation needs, the percentage of a bird species’ population in a state, relative abundance maps, and more.
Land Trusts and Data Summaries
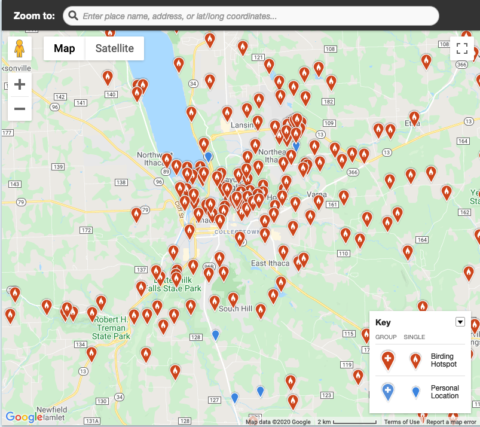
Land trusts can glean much information from state-level data summaries to further their mission and can even zoom in on maps to find data specific to their land. Each data summary contains every bird species that eBird Status and Trends found occupying a state. Birds that are in a state’s Wildlife Action Plan are marked in the summary for states that have submitted their state-specific Wildlife Action Plan to the eBird team. This helps land trusts see which birds are being prioritized at a state level, and if the Recovering America’s Wildlife Act is passed then this information will inform which conservation efforts have funding opportunities.
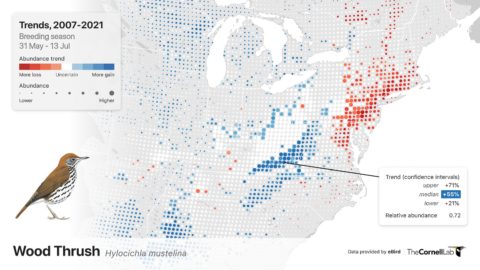
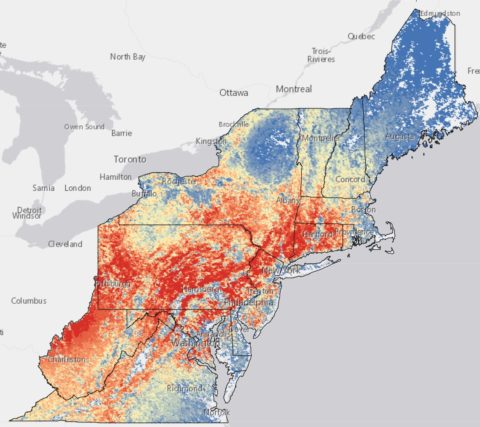
The data summaries show which species are of greatest conservation need within each state, as well as the percentage of each bird species’ population in the state and the maximum population of each bird species during the week that the state has the highest abundance of the species. In other words, land trusts can identify valuable stopover habitat to protect birds migrating in the spring and fall. Using this information, they can strategize land to target for conservation easements, restore existing habitat, and monitor bird species during the migration window.
Another way land trusts can use the state-level data summaries is as a visual tool to engage, fundraise, and inform grant applications about proposed habitat restoration and monitoring projects on their lands. Since the summaries provide maps on relative abundance for breeding and year-round bird species, land trusts can select a specific bird species and generate maps with a 3×3 km. granularity, meaning the information is site-specific and relatable to donors and landowners.
How to Access State-level Summaries
Access the state-level data summaries by selecting your state on the main data summaries page. This will download the .zip folder containing information specific to your state. You can choose whether you want to download the data summary or all the data products at once. After the download is complete, you can open the files and explore.
How will you use the eBird state-level data summaries to protect birds on your land?